2025 Fast Fact Sheet
On this page
List of Figures
List of tables
Summary
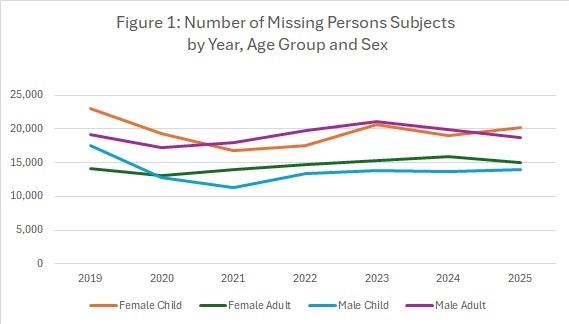
The overall number of persons who went missing decreased by 1% in 2025, from 69,152 subjects in 2024 to 68,349 in 2025, bringing the total number to 8% lower than it was pre-COVID (i.e. 2019). Figure 1 highlights that the most dramatic impact observed during the pandemic was on the number of missing children (under 18 years of age), where the number of missing children has still not yet risen back to pre-COVID levels. The number of missing adults has been above the 2019 levels for the past four years. While missing female adults have exceeded 2019 numbers since 2022, missing male adults did not exceed their 2019 numbers this year, with 512 fewer subjects.
Figure 1: Number of missing persons subjects by year, age group and sex
Text version
| 2019 | 2020 | 2021 | 2022 | 2023 | 2024 | 2025 | |
|---|---|---|---|---|---|---|---|
| Female child | 23,015 | 19,319 | 16,766 | 17,492 | 20,696 | 19,093 | 20,221 |
| Female adult | 14,175 | 13,024 | 13,999 | 14,674 | 15,259 | 15,867 | 14,996 |
| Male child | 17,491 | 12,765 | 11,356 | 13,460 | 13,848 | 13,697 | 14,001 |
| Male adult | 19,236 | 17,298 | 17,998 | 19,768 | 21,059 | 19,974 | 18,724 |
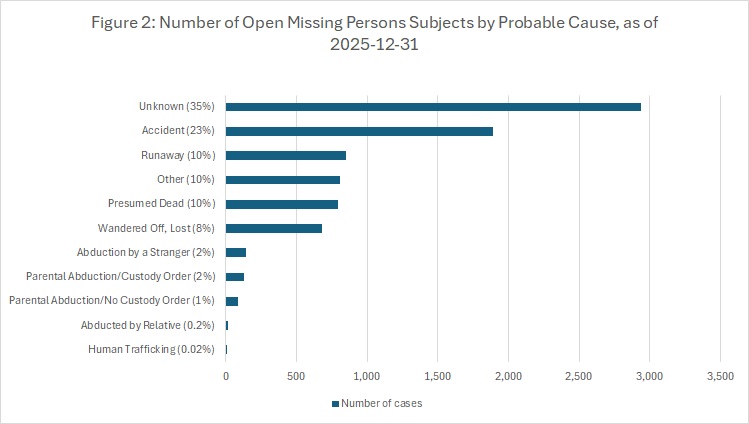
Figure 2 highlights missing person subjects in occurrences that remain open as of December 31, 2025 from all previous years, by probable cause. The oldest open occurrence dates back to 1919. The data in this Figure, when compared to annual statistics in the tables, illustrates that certain types of occurrences may be resolved quicker than others. Only 540 (1%) of people who went missing in 2025 were still missing on the day the data for this report was extracted (February 2nd, 2026).
Figure 2: Number of open missing persons subjects by probable cause, as of 2025-12-31
Text version
| Human trafficking (0.02%) | Abducted by relative (0.2%) | Parental abduction, no custody order (1%) | Parental abduction, custody order (2%) | Abduction by a stranger (2%) | Wandered off, lost (8%) | Presumed Dead (10%) | Other (10%) | Runaway (10%) | Accident (23%) | Unknown (35%) | Total |
|---|---|---|---|---|---|---|---|---|---|---|---|
| 2 | 17 | 83 | 125 | 139 | 677 | 797 | 805 | 851 | 1,891 | 2,942 | 8,329 |
Introduction
The National Centre for Missing Persons and Unidentified Remains (NCMPUR) 2025 Fast Fact Sheet provides a national breakdown of missing persons by province, age (child or adult), sex (female, male, other or unknown), and probable cause. It has been prepared using numbers generated by the national Missing Children/Persons and Unidentified Remains (MC/PUR) database, which provides the necessary data and tools to coordinate a national approach to these investigations. MC/PUR includes occurrences which are currently open, and concluded occurrences that were open any time after May 16, 2014.
The data in MC/PUR is derived from missing persons transactions in the Canadian Police Information Centre (CPIC). Therefore, it is limited by the quality and types of data that agencies enter into CPIC and the techniques used by MC/PUR to compile that data. Not all people who go missing are necessarily reported to police, and not all cases reported to police are entered onto CPIC (especially those that are resolved quickly Footnote 1) but the numbers here are unable to represent those. CPIC transactions include repeat runaways and other situations where a single instance of a missing person may be entered and deleted multiple times over a period of time. MC/PUR uses algorithms in an attempt to identify and eliminate duplicate data and produce more accurate statistics. For this report, each incident for each person is counted as a missing person, but the algorithms avoid counting double entries for the same incident for the same person. An occurrence is considered as belonging to the year 2025 based on the person’s reported “Date Last Seen”. The numbers reported herein reflect a “point in time” and can change if records for 2025 cases are added, modified, or flagged as duplicate. The majority of the MC/PUR reports used for this Fast Fact Sheet were generated on February 2, 2026.
It is also important to note that in terms of probable cause, there is subjectivity in the original CPIC data that populates MC/PUR and it may not be consistently completed by agencies nor maintained as a case evolves and more becomes known.
One hundred and thirty-six (136) missing adults were not included in the adult subjects table as there was no probable cause entered. It is not possible to determine for any one case if the mandatory SEX field in CPIC is capturing biological sex or gender identity, except perhaps for 102 individuals where the recently added value “Other” was used. Since they represent a small percentage of the overall numbers (0.3%), they have not been included in the table below. Of these 102 missing adults of “Other” sex, 20 adults (20%) had the probable cause of runaway, four (4) adults (4%) had wandered off, and 78 adults (76%) were either unknown or other probable cause.
Thirty-three (33) missing children were not included in the child subjects table as there was no probable cause entered. Additionally, 305 missing children (1% of the overall number) were not included in the table as the sex was “Other.” Of these 305 missing children of “Other” sex, 234 (77%) had the probable cause of runaway, three (3) (1%) had wandered off, one (0.3%) had the probable cause of parental abduction/no custody order, and 67 (22%) were either unknown or other probable cause.
While the NCMPUR anticipates that future Fast Fact Sheets will be in a similar format to the one produced this year, the methodology and categories may change in future years and retroactive comparisons to previous years may not be possible. It is important to note that this year’s Fast Facts Figures 1 and 2, and the Summary discussion used missing person counts rather than number of occurrences as per previous yearsFootnote 2.
This fact sheet has been compiled for NCMPUR by Strategic and Operational Services (SOS), Program Research and Development Unit (PRDU).
Fast fact sheet: MC/PUR missing adult subjects by province, sex and probable cause for 2025
| Provinces and territories (Population in 2025 Table 1 note 2) | Abduction by stranger | Accident | Wandered off, lost | Parental abduction with custody order | Parental abduction without custody order | Abducted by relative | Runaway | Presumed dead | Human trafficking | Unknown | Other | Total | |||||||||||
|---|---|---|---|---|---|---|---|---|---|---|---|---|---|---|---|---|---|---|---|---|---|---|---|
| Female | Male | F | M | F | M | F | M | F | M | F | M | F | M | F | M | F | M | F | M | F | M | ||
| Alberta (5,040,871) |
2 | 1 | 1 | 3 | 138 | 240 | 0 | 2 | 1 | 0 | 0 | 0 | 115 | 125 | 0 | 0 | 0 | 0 | 1,078 | 1,304 | 98 | 96 | 3,204 |
| British Columbia (5,683,201) |
4 | 10 | 9 | 34 | 477 | 682 | 4 | 2 | 1 | 1 | 1 | 0 | 463 | 410 | 3 | 5 | 2 | 1 | 4,859 | 5,313 | 903 | 890 | 14,074 |
| Manitoba (1,507,057) |
0 | 1 | 0 | 2 | 30 | 60 | 1 | 0 | 0 | 1 | 0 | 0 | 215 | 177 | 0 | 0 | 0 | 0 | 569 | 536 | 80 | 72 | 1,744 |
| New Brunswick (868,630) |
4 | 1 | 0 | 0 | 8 | 35 | 0 | 0 | 0 | 0 | 1 | 0 | 72 | 71 | 0 | 0 | 0 | 0 | 138 | 230 | 13 | 10 | 583 |
| Newfoundland and Labrador (549,738) |
1 | 0 | 0 | 1 | 1 | 5 | 0 | 0 | 0 | 0 | 0 | 0 | 3 | 5 | 0 | 2 | 0 | 0 | 62 | 66 | 6 | 18 | 170 |
| Nova Scotia (1,091,857) |
0 | 1 | 0 | 0 | 15 | 18 | 0 | 0 | 0 | 0 | 0 | 0 | 3 | 6 | 0 | 0 | 0 | 0 | 47 | 76 | 37 | 66 | 269 |
| Ontario (16,191,372) |
1 | 5 | 5 | 13 | 229 | 497 | 3 | 1 | 1 | 1 | 4 | 3 | 509 | 626 | 3 | 10 | 19 | 1 | 2,099 | 2,724 | 298 | 480 | 7,532 |
| Prince Edward Island (182,508) |
0 | 0 | 0 | 0 | 0 | 1 | 0 | 0 | 0 | 0 | 0 | 0 | 0 | 1 | 0 | 0 | 0 | 0 | 3 | 11 | 0 | 2 | 18 |
| Quebec (9,058,089) |
7 | 5 | 0 | 6 | 69 | 174 | 0 | 1 | 0 | 0 | 0 | 0 | 480 | 1,080 | 4 | 6 | 0 | 0 | 509 | 952 | 202 | 440 | 3,935 |
| Saskatchewan (1,266,234) |
4 | 2 | 0 | 0 | 45 | 45 | 0 | 0 | 0 | 0 | 1 | 0 | 340 | 290 | 0 | 0 | 0 | 0 | 561 | 592 | 30 | 50 | 1,960 |
| Yukon (48,261) |
0 | 0 | 0 | 0 | 2 | 4 | 0 | 0 | 0 | 0 | 0 | 0 | 0 | 1 | 0 | 1 | 0 | 0 | 17 | 21 | 3 | 4 | 53 |
| Northwest Territories (45,848) |
0 | 0 | 0 | 0 | 0 | 2 | 0 | 0 | 0 | 0 | 0 | 0 | 1 | 2 | 0 | 0 | 0 | 0 | 15 | 15 | 3 | 1 | 39 |
| Nunavut (41,919) |
0 | 0 | 0 | 0 | 1 | 0 | 0 | 0 | 0 | 0 | 0 | 0 | 0 | 0 | 0 | 0 | 0 | 0 | 2 | 0 | 0 | 0 | 3 |
| Total (41,575,585) |
23 | 26 | 15 | 59 | 1,015 | 1,763 | 8 | 6 | 3 | 3 | 7 | 3 | 2,201 | 2,794 | 10 | 24 | 21 | 2 | 9,959 | 11,840 | 1,673 | 2,129 | 33,584 |
Fast facts
|
|||||||||||||||||||||||
Fast fact sheet: MC/PUR missing child subjects by province, sex and probable cause for 2025
| Provinces and territories (Population in 2025) Table 2 note 2 | Abduction by stranger | Accident | Wandered off, lost | Parental abduction with custody order | Parental abduction without custody order | Abducted by relative | Runaway | Presumed dead | Human trafficking | Unknown | Other | Total | |||||||||||
|---|---|---|---|---|---|---|---|---|---|---|---|---|---|---|---|---|---|---|---|---|---|---|---|
| Female | Male | F | M | F | M | F | M | F | M | F | M | F | M | F | M | F | M | F | M | F | M | ||
| Alberta (5,040,871) |
2 | 0 | 0 | 0 | 24 | 13 | 0 | 4 | 5 | 6 | 0 | 0 | 1,962 | 1,173 | 0 | 0 | 0 | 0 | 212 | 139 | 26 | 22 | 3,588 |
| British Columbia (5,683,201) |
0 | 1 | 2 | 3 | 134 | 80 | 8 | 6 | 7 | 10 | 0 | 0 | 1,452 | 699 | 0 | 1 | 1 | 0 | 2,208 | 1,029 | 584 | 250 | 6,475 |
| Manitoba (1,507,057) |
0 | 0 | 0 | 0 | 6 | 6 | 1 | 1 | 0 | 2 | 3 | 0 | 1,476 | 495 | 0 | 0 | 0 | 0 | 149 | 76 | 14 | 10 | 2,239 |
| New Brunswick (868,630) |
3 | 1 | 0 | 0 | 1 | 4 | 0 | 0 | 1 | 3 | 0 | 0 | 1,040 | 606 | 0 | 0 | 0 | 0 | 64 | 44 | 4 | 3 | 1,774 |
| Newfoundland and Labrador (549,738) |
0 | 0 | 0 | 0 | 0 | 1 | 1 | 0 | 0 | 0 | 0 | 0 | 10 | 7 | 0 | 0 | 0 | 0 | 14 | 30 | 7 | 13 | 83 |
| Nova Scotia (1,091,857) |
0 | 0 | 0 | 1 | 4 | 1 | 1 | 0 | 1 | 1 | 0 | 0 | 195 | 273 | 0 | 1 | 0 | 0 | 13 | 11 | 12 | 2 | 516 |
| Ontario (16,191,372) |
1 | 0 | 0 | 1 | 26 | 24 | 3 | 6 | 7 | 3 | 2 | 4 | 2,711 | 1,592 | 2 | 2 | 99 | 2 | 1,153 | 729 | 368 | 212 | 6,947 |
| Prince Edward Island (182,508) |
0 | 0 | 0 | 0 | 0 | 0 | 0 | 0 | 0 | 0 | 0 | 0 | 7 | 1 | 0 | 0 | 0 | 0 | 2 | 0 | 0 | 0 | 10 |
| Quebec (9,058,089) |
2 | 3 | 4 | 0 | 14 | 8 | 8 | 12 | 10 | 9 | 1 | 2 | 2,597 | 3,700 | 0 | 0 | 0 | 2 | 314 | 458 | 119 | 135 | 7,398 |
| Saskatchewan (1,266,234) |
0 | 0 | 0 | 1 | 19 | 13 | 1 | 0 | 2 | 0 | 0 | 0 | 2,445 | 1,601 | 0 | 0 | 0 | 0 | 606 | 413 | 25 | 10 | 5,136 |
| Yukon (48,261) |
0 | 0 | 0 | 0 | 0 | 2 | 0 | 0 | 0 | 0 | 0 | 0 | 4 | 1 | 0 | 0 | 0 | 0 | 4 | 1 | 0 | 0 | 12 |
| Northwest Territories (45,848) |
0 | 0 | 0 | 0 | 1 | 0 | 0 | 0 | 0 | 0 | 0 | 0 | 0 | 2 | 0 | 0 | 0 | 0 | 0 | 2 | 0 | 2 | 7 |
| Nunavut (41,919) |
0 | 0 | 0 | 0 | 0 | 0 | 0 | 0 | 0 | 0 | 0 | 0 | 0 | 1 | 0 | 0 | 0 | 0 | 0 | 3 | 0 | 0 | 4 |
| Total (41,575,585) |
8 | 5 | 6 | 6 | 229 | 152 | 23 | 29 | 33 | 34 | 6 | 6 | 13,899 | 10,151 | 2 | 4 | 100 | 4 | 4,739 | 2,935 | 1,159 | 659 | 34,189 |
Fast facts
|
|||||||||||||||||||||||
- Date modified: